
SDSC5001 Course 2-Exploring Data
#sdsc5001
English / 中文
Data Definition
Data is a collection of data objects and their attributes.
-
Data objects are also called records, points, samples, entities, or instances.
-
Attributes are properties or characteristics of objects, such as age, height, weight, education level, etc.
-
Attributes are also called variables, fields, features.
For example, a dataset about people might include attributes like ‘age’, ‘height’, etc.
Data Types
1. Continuous Variable
-
e.g., length, time, count, weight, height.
-
Values are continuous numbers.
2. Nominal / Categorical Variable
-
e.g., race, gender, marital status, eye color.
-
Values are discrete categories with no order relationship.
3. Ordinal Variable
-
e.g., age groups (child, youth, adult, elderly), letter grades, satisfaction ratings (dislike, neutral, like).
-
Values have order but no clear numerical intervals.
4. Interval Variable
-
e.g., temperature, salary range.
-
Values are numerical and have clear interval meaning.
Data Representation Forms
Data Matrix
If all objects have the same set of numerical variables, they can be represented as an matrix, where:
-
: number of objects (rows)
-
: number of variables (columns)
Example:
| Patient ID | Gender | Age | Smoking | Drinking |
|---|---|---|---|---|
| 1 | F | 28 | N | Y |
| 2 | M | 35 | N | N |
| 3 | M | 60 | Y | Y |
Text Data
Represent documents as word frequency vectors:
| I | love | dogs | hate | and | knitting | is | my | hobby | passion | |
|---|---|---|---|---|---|---|---|---|---|---|
| Doc 1 | 1 | 1 | 1 | 0 | 0 | 0 | 0 | 0 | 0 | 0 |
| Doc 2 | 1 | 0 | 1 | 1 | 1 | 1 | 0 | 0 | 0 | 0 |
| Doc 3 | 0 | 0 | 0 | 0 | 1 | 1 | 1 | 1 | 1 | 1 |
Transaction Data
Each record is a set of items, e.g., shopping basket data:
| ID | Items |
|---|---|
| 1 | mask, bread, cola, milk |
| 2 | mask, beer, bread, diaper |
| 3 | mask, beer, diaper |
Graph Data
-
e.g., social networks, molecular structures.
-
Represent relationships with nodes and edges.
Data Quality Issues
1. Noise and Outliers
-
Noise: Perturbation of original values.
-
Outliers: Values that are significantly different from other observations.
2. Missing Values
-
Reasons: Not collected, not applicable, etc.
-
Handling methods:
- Delete objects with missing values
- Impute missing values
- Partially use missing information in analysis
3. Sampling Bias
-
Sample does not match the population.
-
Common reasons: Convenience sampling, class imbalance.
Data Exploration
Purpose
-
Preliminary understanding of data characteristics
-
Help choose preprocessing or analysis methods
-
Utilize human pattern recognition capabilities
Technical Methods
1. Summary Statistics
Used to summarize numerical attributes of data, e.g.:
-
Frequency
-
Mode
-
Measures of location: mean, median, trimmed mean, percentiles
-
Measures of spread: range, variance, standard deviation
-
Skewness
2. Visualization
Convert data into visual forms to facilitate analysis of relationships and patterns.
Visualization Techniques
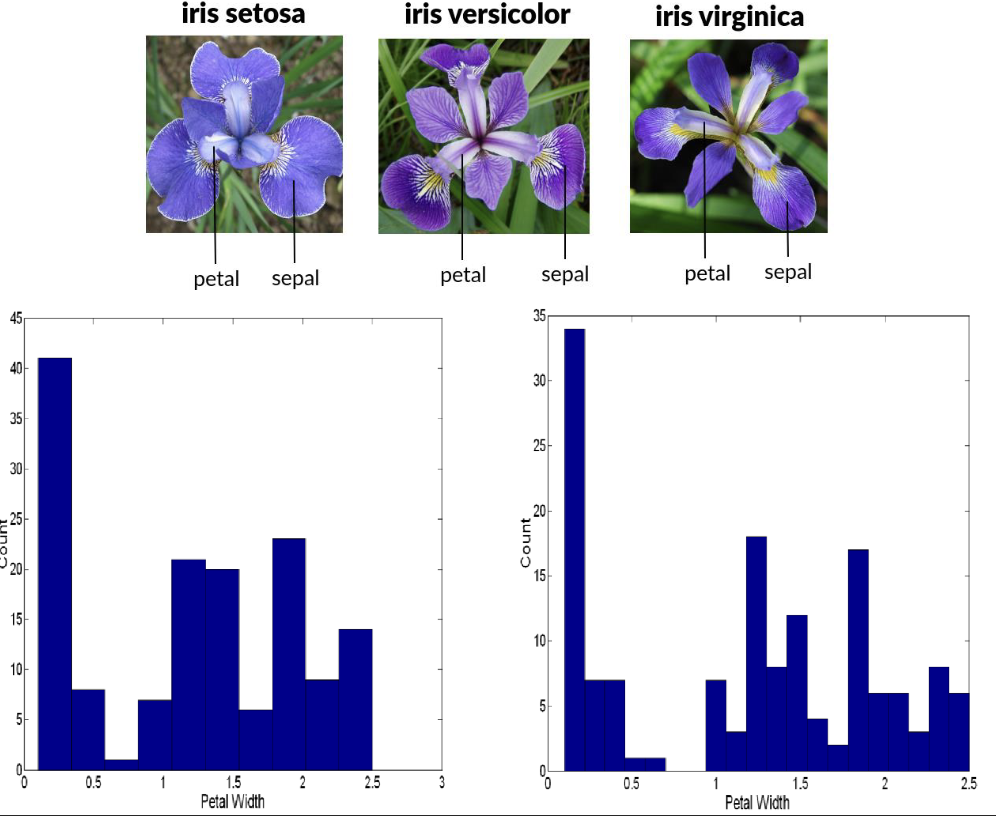
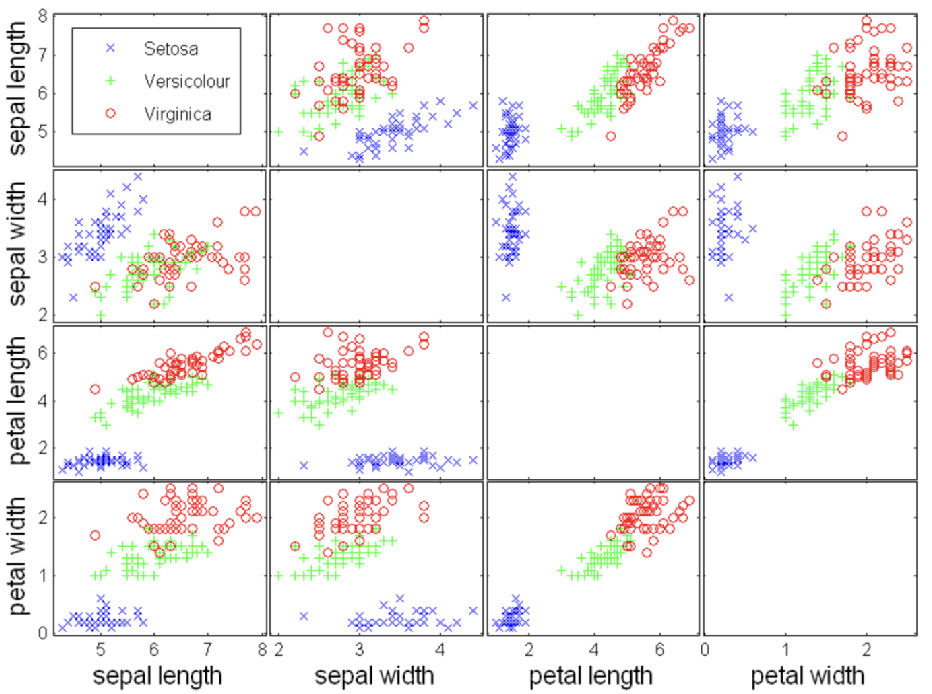
Example dataset: Iris
- Three types of iris flowers: Setosa, Versicolor, Virginica
- Four variables: sepal length/width, petal length/width
- 50 samples per class
Visualization techniques are often used to explore class separability in this dataset.
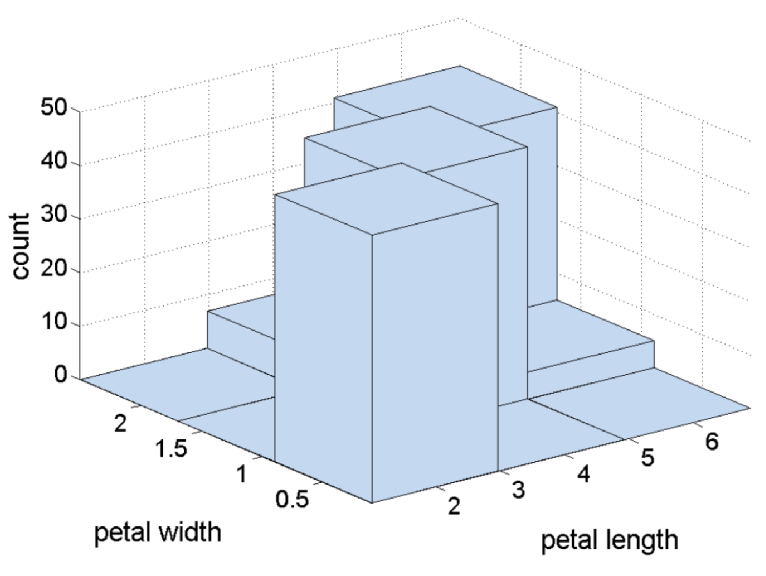
1. Histogram
-
Shows the distribution of a single variable.
2. Scatter Plot
-
Shows the relationship between two variables.
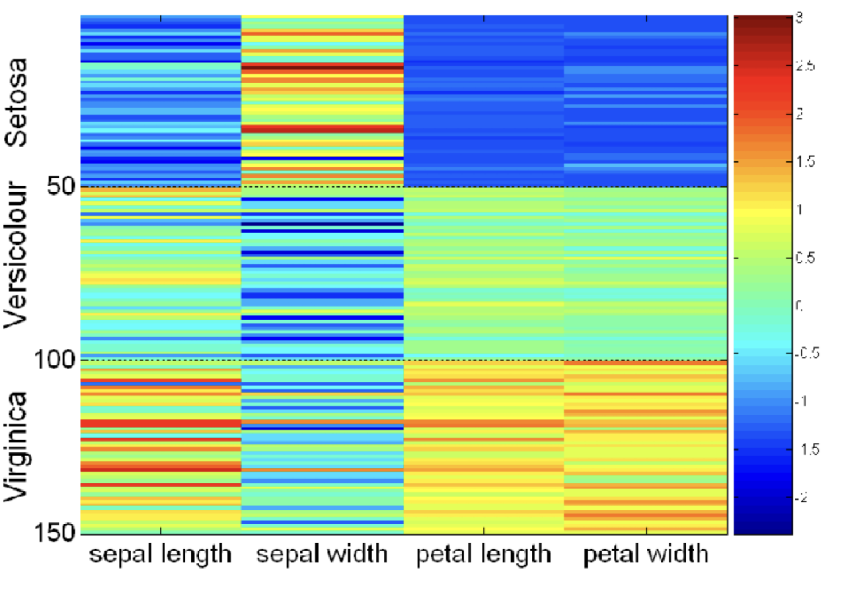
3. Matrix Plot
-
Plots the data matrix, often used for classified and sorted data.
-
Variables often need normalization to avoid dominance.
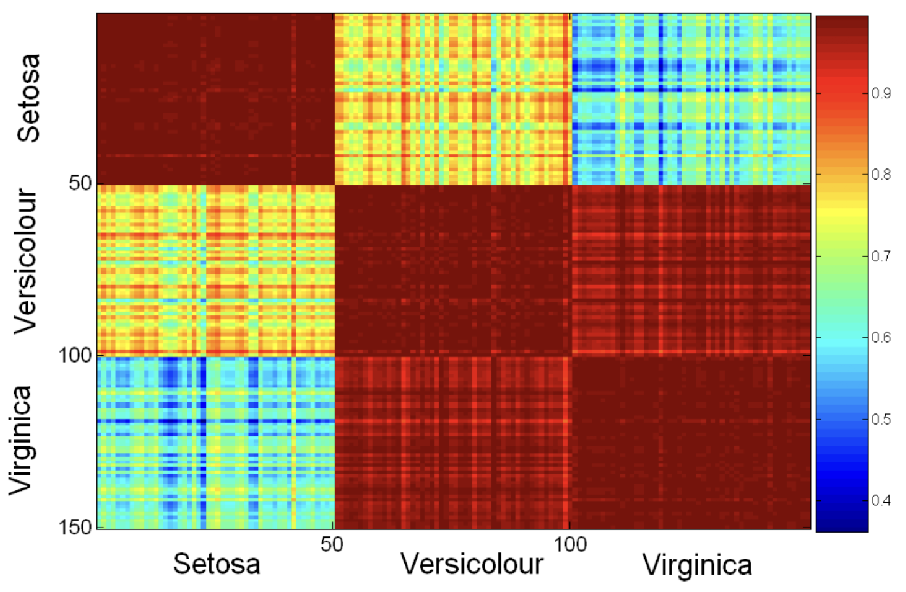
4. Similarity Matrix
-
Uses color intensity to represent similarity between objects.
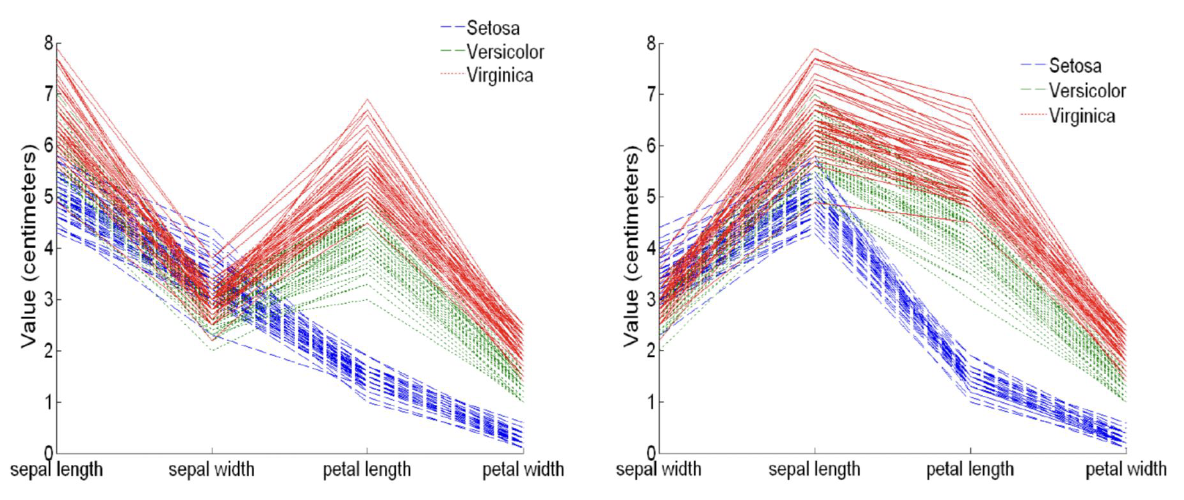
5. Parallel Coordinates Plot
-
Uses parallel axes, each object is a polyline.
-
Variable order may affect the visualization effect.
6. Other Techniques
-
Star Plots: Each object is a polygon.
-
Chernoff Faces: Map variables to facial features.
What does the hell of this damn mapping method?